Do Different AI Models Recommend Different Brands for the Same Purchasing Query?
The same card reader market can surface payment terminals, chip suppliers, and banks. See how to interpret platform differences, check whether they persist, and decide which page to improve.
Explore 12,000+ niche markets with no login required
1. TL;DR
Yes. The same purchasing query can produce different brand recommendations across AI platforms. Each answer reflects a particular need, context, and set of sources. AI visibility has no single ranking that applies across all platforms. Start with your own comparison of the same query, then check whether the differences persist.
Answers also vary within the same platform. SparkToro found that the chance of ChatGPT or Google’s search AI producing the same brand list in two responses was less than 1/100; matching both the list and its order was roughly 1/1000. Aggregating dozens of repeated observations into visibility percentages made a relatively stable set of candidate brands easier to identify. Asking each platform once may capture some variation between individual answers.
Check that the platforms are addressing the same buying need before deciding what to change. In this observation of the Electronic Card Readers market, ChatGPT and Gemini had the same top three brands. Other platforms listed chip suppliers, banks, accessory manufacturers, and payment brands from different regions. Check the product category, region, and scope of the answers before choosing between a shared information fix and an update to a specific source.
If you have already completed an initial AI visibility review, use Dageno’s brand and market analysis to find differences worth investigating in the platform matrix, then examine buying needs, full answers, and cited pages. The example below follows a small business choosing a mobile payment card reader to show how this process leads to a specific task.
2. How Do Brand Recommendations Differ Across Platforms in the Same Card Reader Market?
2.1 Read the Brand Categories Before the Percentages
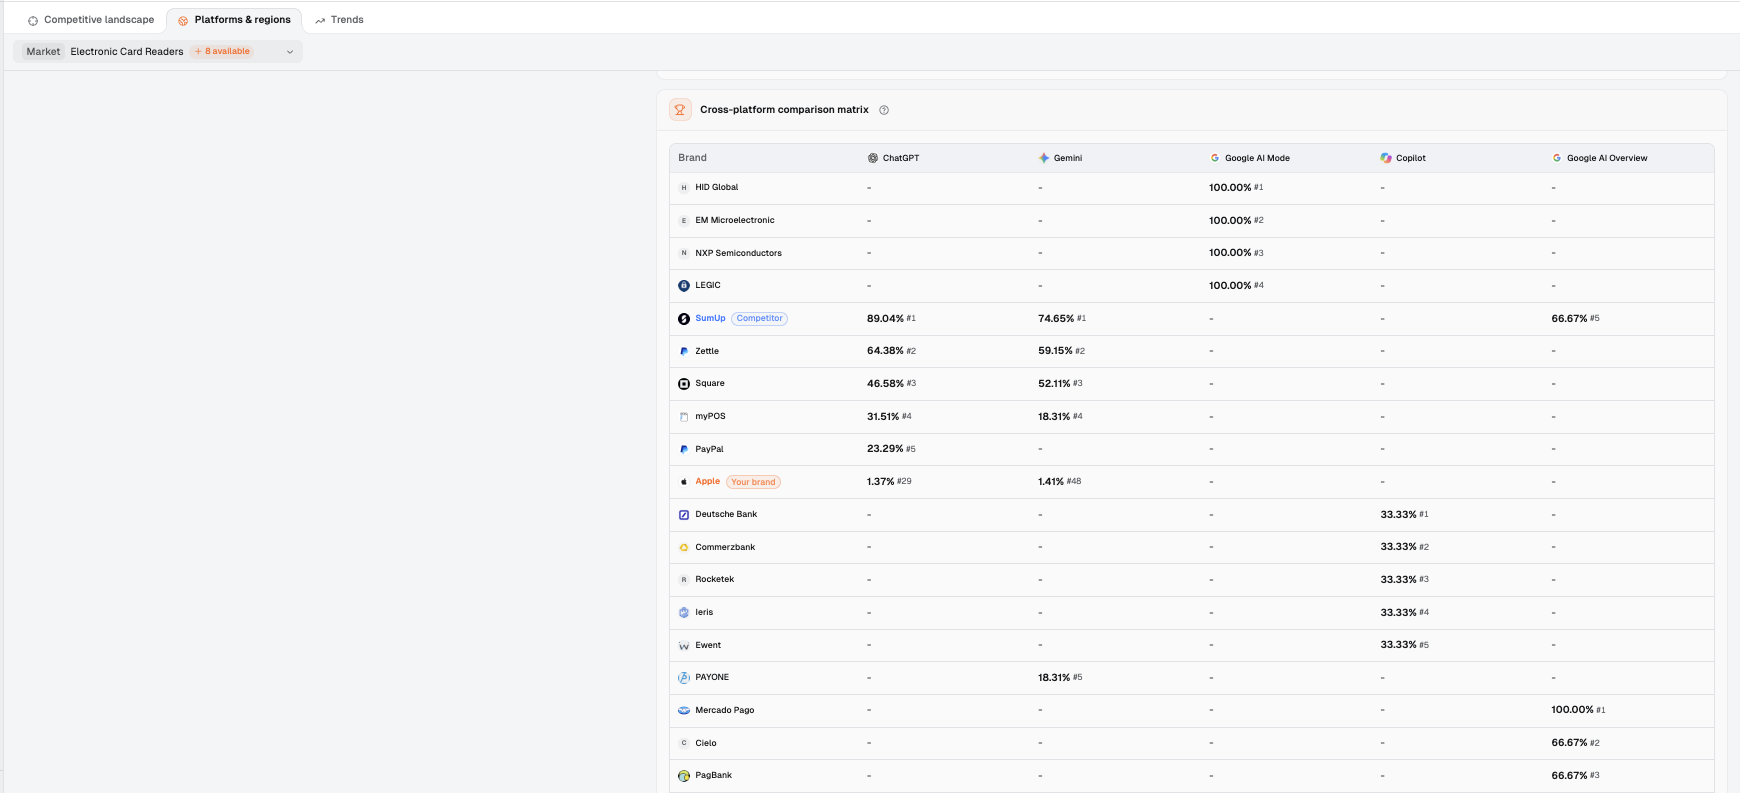
Go to Market & competition → Market overview → Platforms & regions and open the Cross-platform comparison matrix. Each row is a brand, each column is a platform, and each cell shows Visibility and the brand’s rank within that platform.
For the Electronic Card Readers market, answers have currently been collected from ChatGPT, Gemini, Google AI Mode, Copilot, and Google AI Overview. The platform list varies by market. During the same dashboard review, the matrix showed these records:
Mobile payment terminal brands, with the same top three as ChatGPT
Google AI Mode
HID Global 100.00% #1; EM Microelectronic 100.00% #2; NXP Semiconductors 100.00% #3
NFC/RFID reader chip and module suppliers
Copilot
Deutsche Bank 33.33% #1; Commerzbank 33.33% #2; Rocketek 33.33% #3
German banks and general card reader accessory manufacturers
Google AI Overview
Mercado Pago 100.00% #1; Cielo 66.67% #2; PagBank 66.67% #3
Brazilian payment brands
Figure 1: The Cross-platform comparison matrix for Electronic Card Readers shows the platforms with answers currently collected for this market. Platform lists vary by market. The matrix contains more rows than shown here; this image displays the first 19 rows.
For a brand selling mobile payment terminals, the buying needs associated with SumUp, Zettle, and Square are a more relevant starting point than those associated with reader chips or general accessories. The banks and Brazilian payment brands suggest checking the regions, services, and use cases discussed in those answers.
First, identify the brands relevant to your business. Then mark the columns whose product categories and regions need a closer look.
2.2 Brand Counts and Answer Sample Sizes Are Different Things
The number of brands included in the rankings varies substantially: ChatGPT 50, Gemini 85, Copilot 13, Google AI Overview 7, and Google AI Mode 4. These numbers describe the brand set in each column.
The interface defines Visibility as the share of AI answers in which your brand appears, so its denominator is the number of answers. The dashboard does not show answer counts for each platform, leaving insufficient information to verify the sample sizes behind these percentages.
Use the matrix first to identify which categories of brands appear in each column. Before comparing 100.00%, 33.33%, and the percentages in other columns, establish each platform’s answer sample size and align the buying needs, regions, and observation periods. Read the full answers to understand the brand’s role and whether it received an explicit recommendation.
SparkToro’s research on recommendation variability and aggregated visibility also explains why these conditions matter: repeated observations are more useful than a single list for assessing brand performance, and you need to know which answers went into the aggregate.
Record ranked brand counts and answer sample sizes separately. Establish the answer sample sizes before comparing platform percentages.
3. What Might Explain Different Lists, and What Should You Check Next?
3.1 Check Whether the Answers Discuss the Same Product Category
A “card reader” can mean a device for accepting payments, or a chip, module, or accessory that reads NFC/RFID information. Different buying tasks can bring different brands into consideration.
This matrix includes payment terminals, reader chips, and banks. To explain the differences, read the answers: are they discussing merchant payments, identity verification, or another use for a reader? Which regions and equipment requirements apply?
Google’s documentation on AI search features and query expansion explains that AI Mode and AI Overviews may use query fan-out: multiple searches across related subtopics and data sources. They may also use different models and techniques, producing different answers and links. This provides context for Google’s search mechanisms. For a particular column in the matrix, look for the explanation in its underlying answers.
Open answers within a sub-intent where the difference is clear, and record the product category, use case, and region they actually discuss.
3.2 Aggregate Repeated Observations Before Judging a Persistent Gap
Even when the question stays the same, a platform may return a different brand list.
SparkToro’s study of consistency in AI brand recommendations, published on 2026-01-27, reported a less than 1/100 chance that ChatGPT or Google’s search AI would give the same brand list in two responses. Matching both the list and its order was roughly 1/1000. The study also found that aggregating dozens of repeated results into brand appearance percentages made a relatively stable set of candidates easier to identify.
This finding concerns variation within a platform. If you ask several platforms once and your brand appears in one answer but is absent from another, save the results and keep observing. Gaps that recur across repeated records deserve closer investigation.
The matrix provides an aggregate view at the market level. To see whether a difference persists for a specific purchasing question, collect a separate set of repeated answers under the same conditions. Save the current matrix and relevant answers, then build further observations around a consistent buying need.
3.3 Trace Source Differences to Specific Cited Pages
Two answers about mobile payments may use different sources: one may cite a brand’s website, while another cites a comparison article. Those pages offer different information. An official site may explain equipment and service requirements; a comparison page may select products by fees, features, or use case.
Semrush’s study of sources in ChatGPT and Google AI Mode, published on 2025-09-03, covered five industries: finance, digital technology, business services, consumer electronics, and fashion. The source mix differed between the two platforms in that study’s sample. For the card reader example, examine the pages cited in the actual answer and the recommendation rationale each page supports.
For example, if an answer recommends a terminal as suitable for occasional payments, check whether the cited page explains recurring fees, transaction conditions, and supported regions. Choose one recommendation rationale, open its source, and identify the text that supports it.
4. Move from the Market Matrix to a Sub-intent to Understand Why Brands Appear
4.1 Read Full Answers with Platform and Region Labels
Go to Market & competition → Demand & insights → Search intents → Recommendations → Choose for your needs, click View AI responses, and open Source answer.
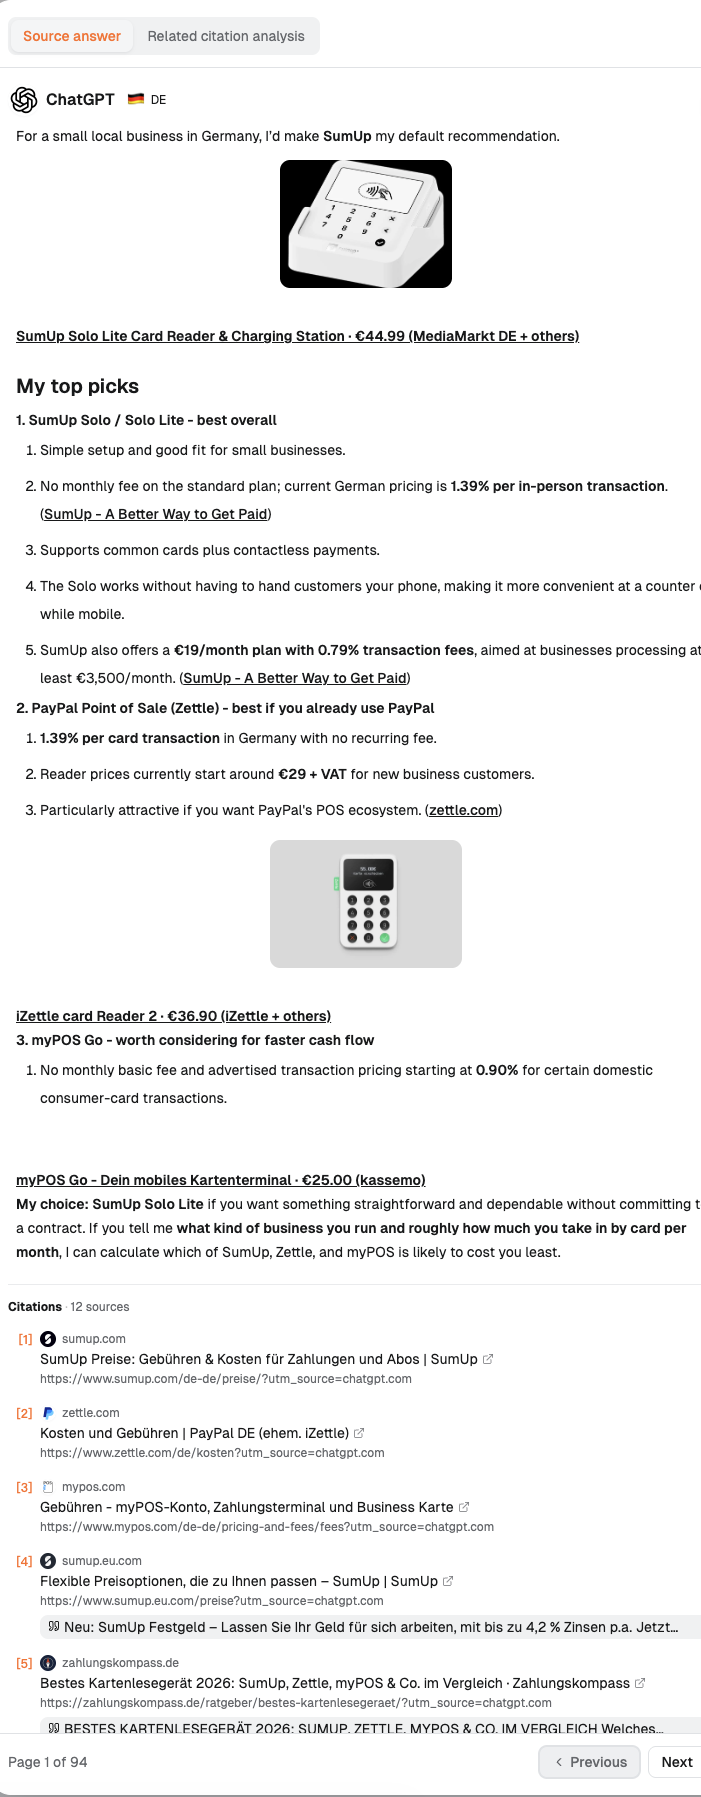
Answers are grouped under the same sub-intent. You can page through them individually, with the platform and region shown at the top. In this example, Choose for your needs contains 94 answers across all platforms. Answer 1 is labeled ChatGPT 🇩🇪 DE and introduces SumUp Solo / Solo Lite, followed by PayPal Point of Sale (Zettle) and myPOS Go. The bottom shows Citations · 12 sources.
Figure 2: Page excerpts from the same ChatGPT 🇩🇪 DE answer, with screenshots of the top and ending joined vertically. The middle is omitted. The lower section shows Citations · 12 sources and some of the cited sources.
Go beyond identifying which brands appear: what conditions earned them a place? Is the answer comparing equipment prices, ongoing costs, or a particular business scenario? Then open the cited pages and check whether those reasons match current product facts.
4.2 Check What You Are Comparing Before Choosing an Action
This is the article’s editorial framework, not an official standard or a Dageno feature.
What you find
Priority action
Card reader example
Answers cover different product categories or regions
Group comparable buying needs first
Separate merchant payment terminals from chips, modules, and general accessories
Comparable answers repeatedly omit the same fact, and public pages also lack it
Fill the shared information gap
Explain fees, equipment requirements, or regional conditions
An answer with a platform label uses outdated information
Address the specific source
Check the old model or description against current evidence
Records are limited, or buying conditions are not yet aligned
Gather more observations
Complete the need, platform, region, and time records
These four situations call for work in different places. When categories are mixed, organize the records first. When a page genuinely omits a key condition, the content team has a specific edit to make. Choose one task for the difference you found, and state which answer and page to examine next.
5. How Do You Move from Aggregate Fields to Specific Buying Needs in Dageno?
Individual lists change, so start with aggregate performance and use full answers to investigate the reasons. Narrow the scope through the brand, market, and buying need.
5.1 Start with the Brand Overview, Then Open the Platform Matrix
In Overview → Brand overview, confirm the brand and market before reading Visibility, Visibility rank, and Ghost citations rate. Here, the selected brand is Apple and the market is Electronic Card Readers. The interface shows Visibility 1.32%, Visibility rank #42, and Ghost citations rate 50.00%.
The fields most directly relevant to this question are Visibility, Visibility rank, and Platforms. The first two show how often the brand appears and where it ranks within the current scope. Next, go to Market & competition → Market overview → Platforms & regions to examine the brand sets in the platform table and matrix. Platforms and Regions present platform and regional information separately.
Dageno’s platform coverage extends beyond the platforms shown in any single market screenshot and also includes Claude and Perplexity. The Platforms table shows the platforms with answers currently collected for that market, so its list varies by market.
After confirming the brand and market, choose the matrix columns worth investigating through their full answers.
5.2 Select the Mobile Payment Need in Search intents
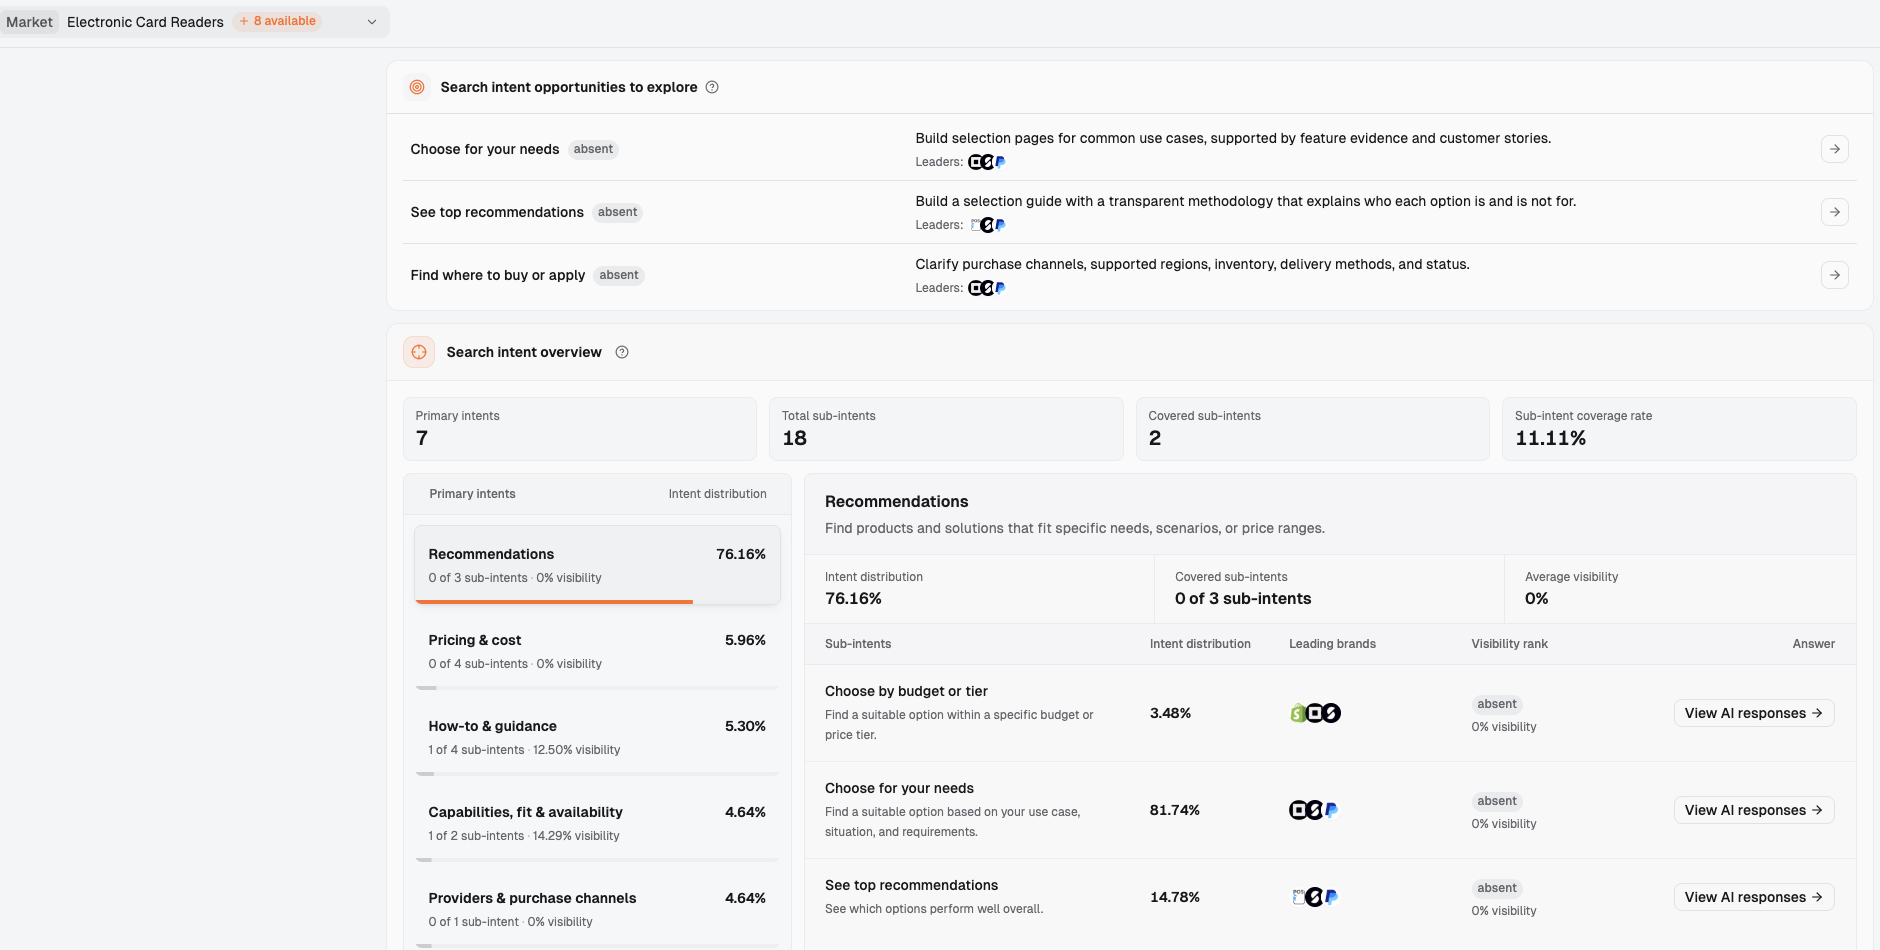
Go to Market & competition → Demand & insights → Search intents. In this example, Search intent overview shows Primary intents 7, Total sub-intents 18, Covered sub-intents 2, and Sub-intent coverage rate 11.11%, describing the selected brand’s intent coverage.
The seven intent categories are:
Recommendations
Pricing & cost
How-to & guidance
Capabilities, fit & availability
Providers & purchase channels
Evaluation & comparison
Informational research
For a small business choosing a mobile payment reader, start with Recommendations. It contains three sub-intents: Choose by budget or tier, Choose for your needs, and See top recommendations. In this example, the selected brand shows absent and 0% visibility for all three.
Figure 3: The three sub-intents under Recommendations, each with a View AI responses button. Choose the sub-intent that matches the buying task, then read the full answers.
Choose for your needs lets you investigate the equipment, business type, and usage conditions discussed in the answers. Click View AI responses on that row and read the full answer in Source answer.
5.3 Manage Monitoring Scope and Page Performance Separately
In Settings → Monitoring settings → Competitor monitoring, use Manage competitors to manage competing brands and Save competitors to save your selection. Monitored prompts offers Import prompts and Add prompts in bulk. It shows No Data in this example; the current market observations come from Dageno’s own question library.
To track content pages later, go to Action → Effect tracking. Brand mention rate is defined as “Brand attribution within answers citing tracked pages”: whether the brand is named in answers that cite those pages. Ghost citation rate is defined as “Tracked pages cited without a brand mention,” covering cases where the page is cited but the brand is absent. URL citation rate appears in the Tracked pages table and shows citation information for tracked URLs.
These fields help you assess page performance. When assigning content work, save the buying need and competitor scope, then record the actual page URL to update and a review date.
6. Use Market and Sub-intent Sources to Check Competitors’ Recommendation Reasons
6.1 Choose the Source Scope Before Opening a Page
Market-level sources appear in Channel analysis → Citation analysis, with five tabs: Top cited sources, Citation gaps, Competitor citations, Top cited pages, and Ghost citations. Filtering uses brand/domain search and Domain type, whose options include Company Sites, Official Sites, and Editorial & News.
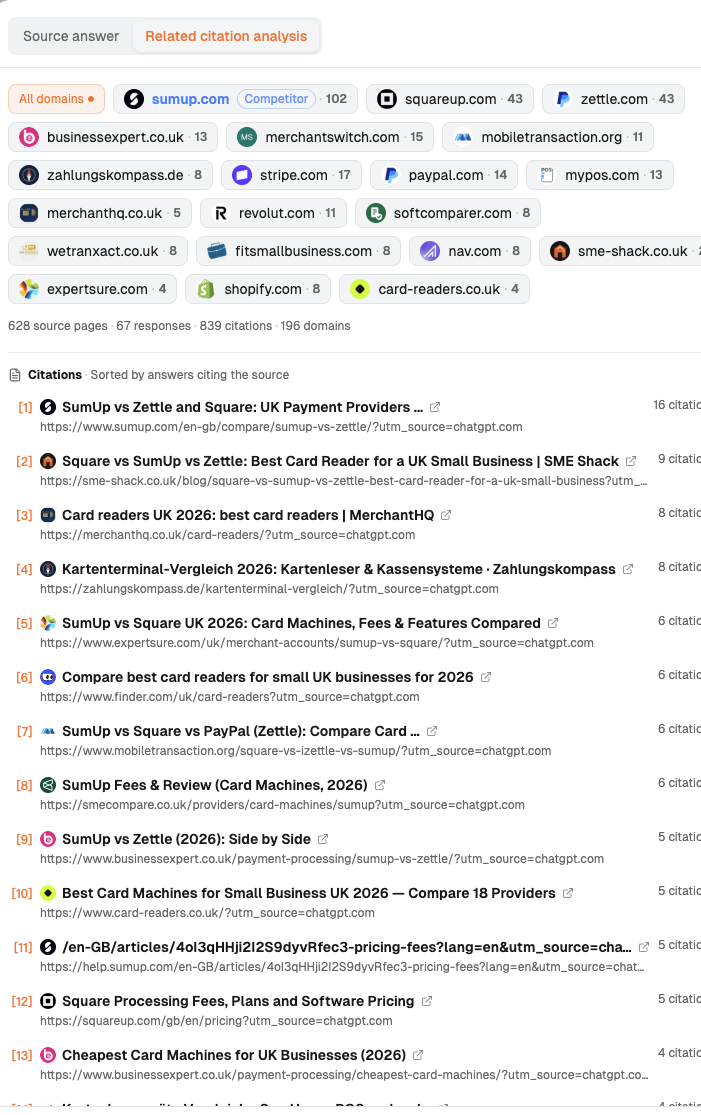
To focus on a sub-intent, switch to Related citation analysis within View AI responses. Here, Choose for your needs shows 628 source pages · 67 responses · 839 citations · 196 domains. The 67 responses here and the 94 answers in Source answer use different counting scopes: the former counts answers included in this page’s citation analysis, while the latter is the total number of answers you can page through under this sub-intent. Explain each number using the scope of the page it comes from, and keep the two counts separate.
Figure 4: Related citation analysis aggregates sources across all platforms for the Choose for your needs sub-intent, showing 628 source pages · 67 responses · 839 citations · 196 domains. To investigate citations from a particular platform, return to an individual Source answer with that platform’s label.
Decide whether you are examining the whole market or one sub-intent, then open the sources relevant to the buying conditions.
6.2 Return to a Labeled Answer for Platform Evidence
To investigate why a platform mentions a brand, return to Source answer and read the platform and region labels alongside that answer’s citations. Market and sub-intent source summaries help you find pages to investigate; an individual answer connects the platform, recommendation rationale, and source.
7. Should You Fix a Shared Gap or a Problem in One Answer?
7.1 Fill a Shared Gap When Comparable Answers Repeatedly Miss the Same Fact
First, select answers that genuinely discuss mobile payments, then group them by region and usage conditions. Suppose comparable answers repeatedly omit a required fee, and the existing page only gives the device price. The team now has a shared information gap to address.
Update the relevant regional product page with the fee structure, calculation period, required equipment, and applicable conditions. When several platforms need the same fact, clarify it in one place first, then observe subsequent answers.
Add the confirmed missing buying condition to the existing page, along with the applicable region, product version, and current evidence.
7.2 Fix the Specific Page When One Source Is Wrong
If an answer uses an old model or outdated fees while other comparable answers already use current information, start with the page it cites.
Your team can update an owned page. For an external page, compile the incorrect wording, current evidence, and applicable scope for the person contacting its author. If the product genuinely fails to meet the buyer’s requirements, ask the product or marketing lead whether this is the type of buyer the business aims to serve.
Send the page owner the wording to correct, the accurate facts, and the source URL, specifying which passage needs an update.
7.3 Check Whether Changes Persist in Comparable Follow-up Records
Save the edit date, page URL, sub-intent, platform, region, and full answers from before and after the change. During the review, check three things: whether the brand appears, whether the recommendation rationale is accurate, and whether the cited source has changed.
On the review date, read answers under the same sub-intent, organize them by platform and region, and record changes in brand appearances, facts, and sources.
8. Conclusion: Understand the Platform Differences Before Deciding What to Change
In this card reader market observation, the first issue to resolve is what is being compared. Some columns concern mobile payment terminals; others contain chips, banks, or payment brands from different regions. The matrix helps the team spot differences, full answers clarify the buying task, and cited pages identify where an edit may be needed.
Understand the platform differences before deciding what to change. If comparable buying needs repeatedly lack the same fact, fill the shared gap. If a specific source is the problem, address that page. If the observation scopes are still misaligned, organize the records and gather more samples first.
9.1 Is One Query per Platform Enough to Assess Brand Performance?
A single observation helps you find leads to investigate. SparkToro’s study of brand recommendation consistency found that the chance of ChatGPT or Google’s search AI returning the same list in two responses was less than 1/100, or roughly 1/1000 for the same list in the same order. Aggregating repeated observations makes a relatively stable candidate set easier to identify. Save each full answer, record the need, region, time, and answer count, and build comparable records before judging the gap.
9.2 Why Does One Card Reader Market Include Payment Brands, Chip Suppliers, and Banks?
Open the answers individually and identify their product categories, use cases, and regions. Google’s explanation of query expansion in AI search provides context for how its search features find related information. Check the answers for the explanation in each case.
Our editorial judgment is that, when an entire column belongs to another product category and the individual answers confirm the difference in use, the first interpretation should usually be that the platform understood a different buying task, rather than that your brand lost the competition on that platform. Clarify the product category, use case, and usage conditions first, and reserve ranking comparisons for answers that actually address comparable buying tasks.
9.3 What Can the Matrix and the Answer Drawer Each Tell You?
The matrix shows platforms with answers currently collected for that market, and the list varies by market. It helps identify market-level differences. View AI responses under Search intents opens answers within the same sub-intent; Source answer shows the platform and region at the top so you can check the recommendation rationale. Choose one difference in the matrix, then read the relevant sub-intent’s answers individually.
9.4 How Can I Check Which Page a Platform Cited?
Read the citations in an individual Source answer with a platform label. Market-level Citation analysis and sub-intent-level Related citation analysis organize sources within their respective scopes. Save the answer’s platform label, exact recommendation wording, and cited URL, then open the page to verify it.
9.5 When Should I Fill a Shared Information Gap Versus Update One Source?
Fill a shared gap when comparable answers repeatedly miss the same fact and public pages also lack it. Update a specific page when an outdated source causes an error. If product categories or regions differ, organize comparable records first. Using the editorial framework in section 4.2, turn the finding into a page task supported by the original answer and factual evidence.
Google Search Central’s documentation on AI features and websites explains query fan-out, answers and links in Google’s search features, and foundational content requirements.
Dageno is the research and insights team at Dageno AI, publishing industry reports and expert analysis on AI Search Visibility, Generative Engine Optimization (GEO), and AI-powered search discovery.