AI Search Intelligence Platform

AI search is rewriting the competitive landscapeSee what’s changing.Find your next growth move.

Enter your brand and choose a market

  • Free check, no login required
  • Data across 12,000+ niche markets
  • Results in 5 seconds

~/>Trusted by

3,700+

Trusted by B2B SAAS, Retail & eCom, Agencies

Who's Leading? and What Do Customers Want?Where Is Your Brand Behind?

Start with market position, the competitive landscape, Search Intents, citation sources, and search signals.

MI.01

Brand Position in the Market

Where does the brand stand in its current market?

Compare the brand's position, gap to the leader, and signals of change within the same market, model, region, and time range.

Apple brand market position: 52.8% visibility, visibility rank #2; includes sample data for AI visibility rankings, platforms, regions, and competitive sets.
Applein Mobile Phones & Mobile Devices ranks high-tier visibilityCompared with 91 brands · 3 purchase scenarios need attention
Visibility
52.8%↗ 27.6%
Visibility Rank
#2— Flat
Ghost citations rate
0%— Flat
AI Visibility Leaderboard
View all data
1SamsungCompetitor69.0%
2AppleOwned Brand52.8%
3Garmin49.2%
4Huawei20.8%
Platforms
View
PlatformRankVisibility
Copilot#1 / 10156.9%
Google AI Mode#2 / 15549.7%
ChatGPT#2 / 30947.1%
Region
View
RegionsRankVisibility
US#2 / 16162.3%
FR#2 / 12558.2%
GB#3 / 12942.8%
AI Competitive Set
View all data
GoogleCo-mention index 66
SamsungCompetitorCo-mention index 65
XiaomiCo-mention index 48
OnePlusCo-mention index 44
ASUSCo-mention index 33
MI.02

Citation Sources

Which sources does AI rely on when describing your brand?

Trace insights back to cited domains, URLs, and original AI answers to see where you need stronger official content, third-party reviews, or channel coverage.

Citation source overview: 1,029 sources and 266 answers in total. Shows citation data for YouTube, Reddit, Facebook, Garmin, TechRadar, Apple, and Tom's Guide.
All domain types
Total 1,029 sources
youtube.comSocial Media418 citations32.7% of answers cite this source
reddit.comForums172 citations28.9% of answers cite this source
facebook.comSocial Media106 citations7.9% of answers cite this source
garmin.comCompany82 citations13.9% of answers cite this source
techradar.comVertical Media72 citations15.8% of answers cite this source
apple.comOwned BrandCompany67 citations11.3% of answers cite this source
tomsguide.comVertical Media44 citations9.0% of answers cite this source
MI.03

Demand & Product Opportunities

Where can your brand win?

Explore three layers—demand scenarios, competitor selling points, and niche markets—to find the scenarios where you are absent, the selling points you are losing, and the categories where you trail.

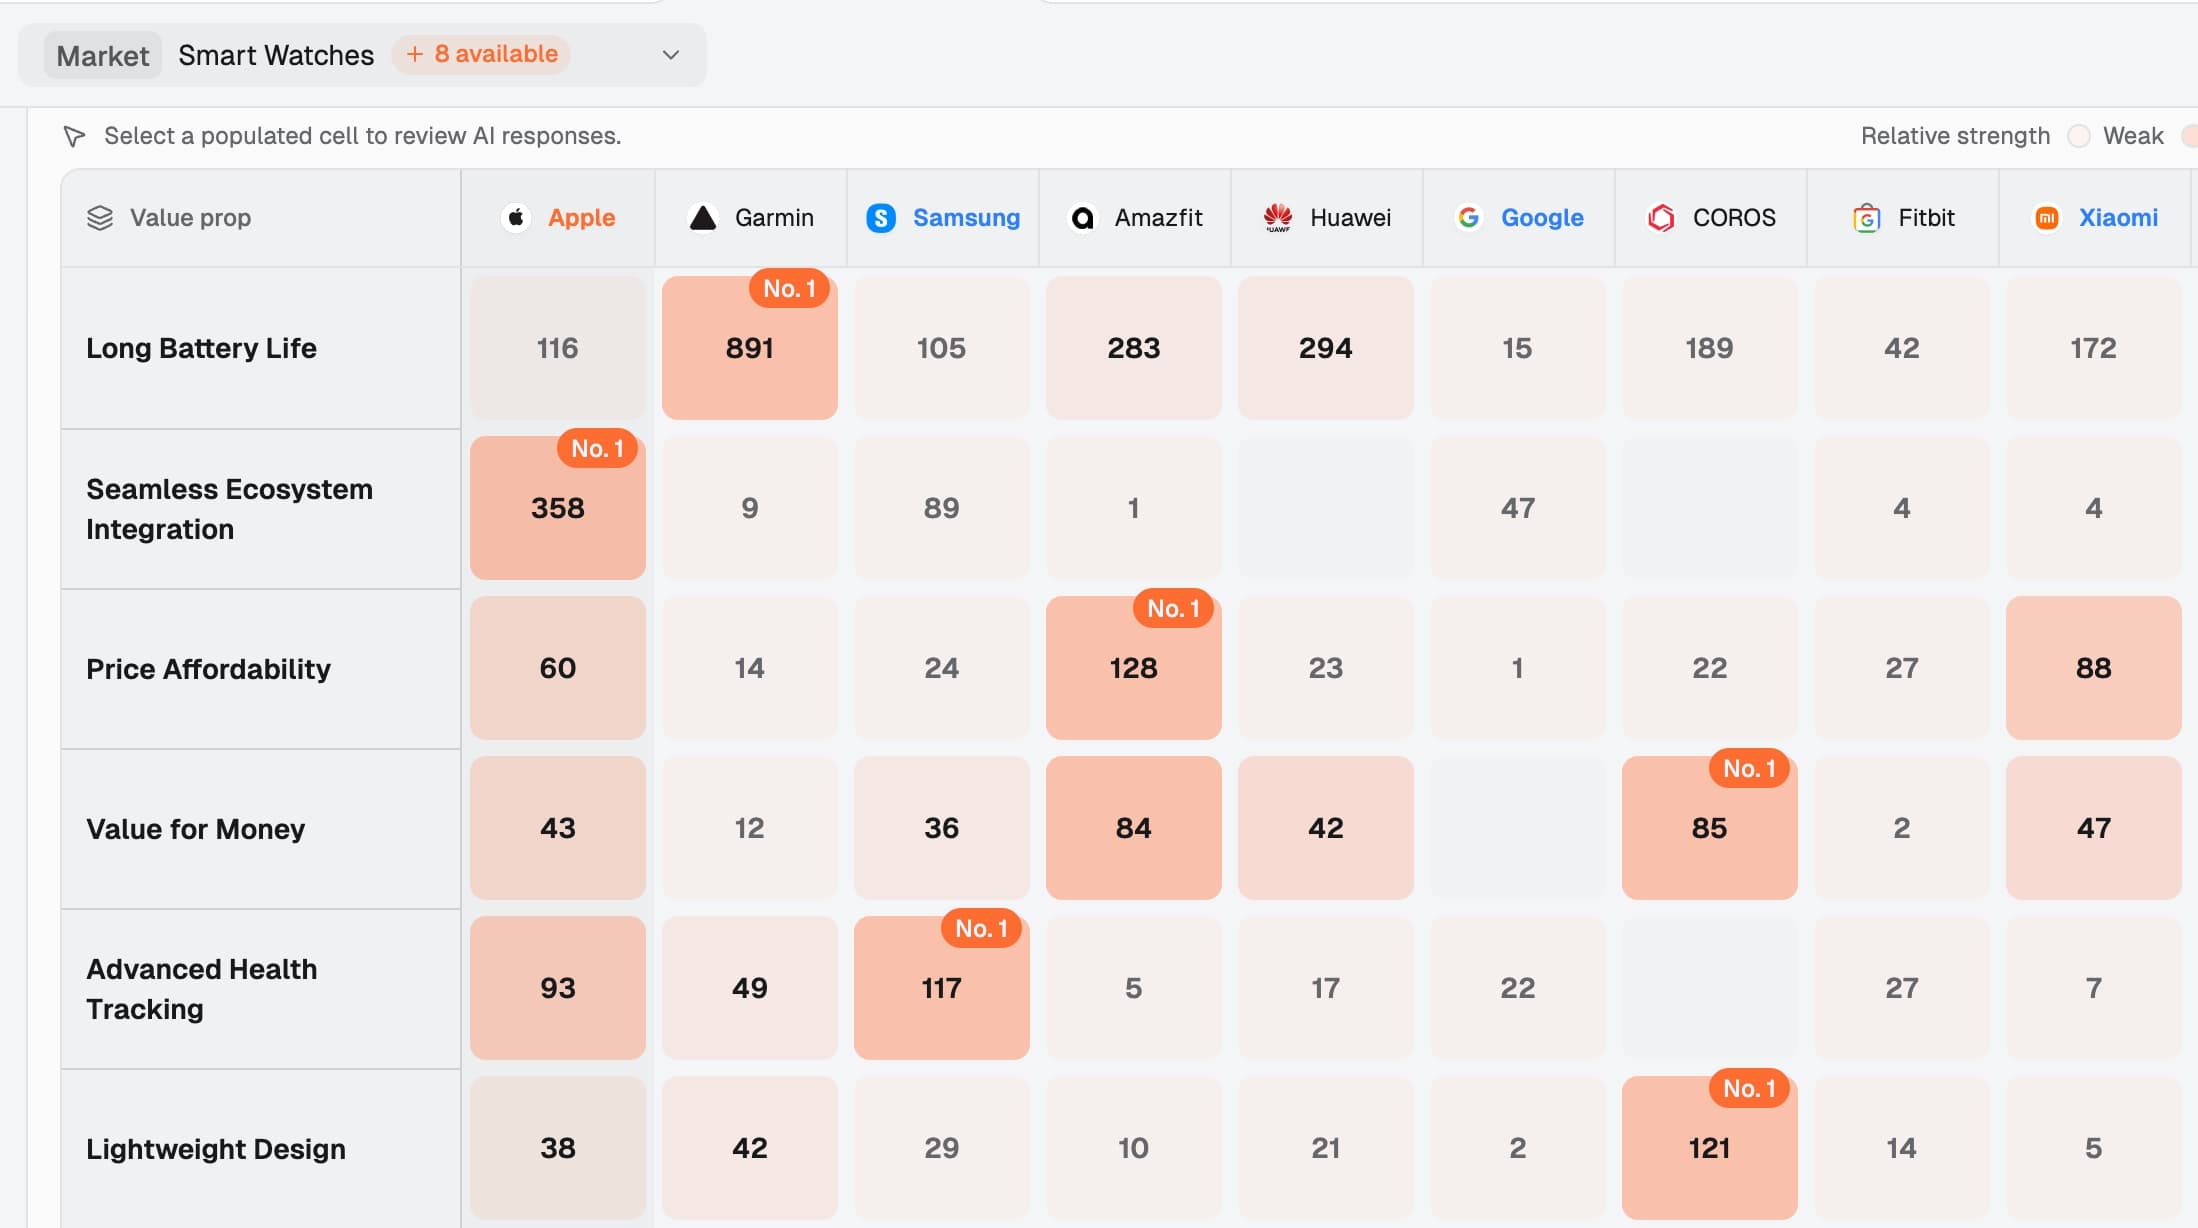
Search Intent framework: 22 in the full framework, 22 observed, 19 covered, with 86.4% Search Intent coverage; layered with a brand and selling-point share heatmap.

Search Intent framework: coverage, leading brands, and next actions

Full Framework22Search Intent Subcategories
Observed22With answer samples
Covered19Scenarios where the brand appears
Search Intent Coverage86.4%Current Coverage
Value & Importance
Ranked #2Visibility 100.0%
Leading Brands
Recommended Action

Use original data, statistics, and quantified case studies to prove value and importance.

Current Brand 1 items / total 1 answers

View original answer
Concept Comparison
Leading #1Visibility 100.0%
Leading Brand
Recommended Action

Add concept comparisons and product differentiation, and keep covering user decision scenarios.

Current Brand 1 items / total 1 answers

View original answer

Subcategory rankings

Configure competitors
L3
Smart Phones
#2
#1Samsung72.2%
#2Apple51.1%
#3Google37.2%
14,068 answers · 620 brands
L3
Laptops
#3
#1Dell58.9%
#2Lenovo42.7%
#3Apple36.9%
9,493 answers · 298 brands
L3
Smart Watches
#1
#1Apple53.0%
#2Garmin46.5%
#3Samsung36.4%
3,143 answers · 408 brands
Brand × Value Prop Share Heatmap
MI.04

Organic search and traffic structure

Where does your traffic differ from competitors?

Compare your traffic trends, geographic distribution, and traffic sources with competitors

Organic search and channel signals: Apple’s official site has 581.98M monthly visits, 35.6% from organic search, 2.2% from AI referrals, and 3.31 pages per visit; global rank #71 and U.S. rank #49. Includes traffic trends, top markets, and eight rows of keywords, monthly search volume, CPC, and estimated keyword value for Apple and #SEOFOMO. Sample product data.
AppleOwned Brandapple.com
Global Rank#71
US Country Rank#49
Monthly Visits 581.98M
Organic Search Share 35.6%
AI Referral Share 2.2%
Pages per Visit 3.31
Traffic Trend
Top Markets
US36.2%
IN4.9%
GB4.3%
JP4.0%
CA3.5%
Brand market distribution comparison
Brand & DomainTop Market2nd Market3rd Market4th Market5th Market
AppleOwned BrandUS36.2%IN4.9%GB4.3%JP4.0%CA3.5%
SamsungCompetitorUS21.5%KR12.6%IN8.6%BR4.9%DE4.6%

AI Shopping & AI Ads

AI search is becoming a new gateway to products and advertising

AI SHOPPING

Where do your products appear in AI Shopping?

See which products appear, why competitors get selected, and which product data to improve.

AI ADS

New ad placements. New growth opportunities.

See what competitors are actually running, compare differences in their selling points, and decide where your budget should go.

From discovery to retesting

Find the highest-priority
growth action

Dageno shows how your brand performs across real customer questions, explains what shapes AI answers, turns gaps into team actions, and retests the results.

Dageno Actions
USB-C Docking StationFrom discovery to retesting
Example Scenario
01 Spot changes
Customers ask AI
“Which USB-C docking station is better for cross-border teams that need multi-device compatibility?”
AI ANSWERBrand A and Brand B lead the shortlist

Public information gives AI stronger evidence of their compatibility, reliability, reviews, and purchase channels. Your brand needs stronger proof of long-term stability and cross-system compatibility.

05 Retest
Same set of 48 questions

After changes go live, rerun the same question set to measure how AI answers change.

Day 14 after action
Before action42%
After action65%
Entered shortlist
31 / 48
+11 questions
Average rank
3.4
Up 1.2 positions
New citations
7
Across 4 pages

DAGENO DATA FOUNDATION

Built onreal AI search data

Dageno standardizes AI search data daily across models, markets, and channels. It connects answers, citations, products, ads, and search signals into one traceable foundation for market decisions.

500 M+

Advertising data

Ads, advertisers, and placements across ChatGPT and Google AI.

100 M+

Product data

Products, prices, reviews, merchants, and citations across AI shopping.

12K+

Market segment data

Market data across 12,000+ market categories.

10+

Mainstream AI models

Supports leading models including ChatGPT, Gemini, Google AI Overview, Perplexity, Grok, and more.